现有生成模型评估方法只关注学习分布与目标分布之间的"距离",却从未量化该测量本身的置信度。
本文形式化了"生成模型学习中的不确定性量化"问题,并提出以集成 Precision-Recall 曲线为核心工具,
通过多次独立训练的模型来捕获模型近似目标分布时的不确定性区间。Existing evaluation methods for generative models focus solely on the "distance" between the learned and the target distribution, yet never quantify the confidence of that measurement itself. This paper formalizes the problem of "uncertainty quantification in generative model learning" and proposes ensemble Precision-Recall curves as the core tool, using multiple independently trained models to capture the uncertainty interval of a model's approximation to the target distribution.
不确定性量化Uncertainty QuantificationGenerative ModelsPrecision-Recall CurvesEpistemic UncertaintyEnsemble MethodsDDPMDistribution Evaluation生成模型评估Generative Model Evaluation
01动机(Motivation)Motivation
生成模型(Generative Models)已广泛应用于粒子物理、天气预报、医疗等高风险领域。
然而,现有所有评估指标——FID、IS、Precision-Recall 等——仅测量学习分布与目标分布的"距离",
却完全忽视了这种测量本身蕴含的不确定性。一旦分布对齐偏差微小,就可能导致错误的科学结论或不可靠的预测。Generative Models are already widely deployed in high-stakes domains such as particle physics, weather forecasting and medicine. However, all existing evaluation metrics — FID, IS, Precision-Recall and the like — measure only the "distance" between the learned and the target distribution, while entirely ignoring the uncertainty inherent in that measurement. Even a small deviation in distribution alignment may lead to erroneous scientific conclusions or unreliable predictions.
"No work quantifies the confidence in the measured closeness between the learned and target distributions."
—— 论文原文from the paper
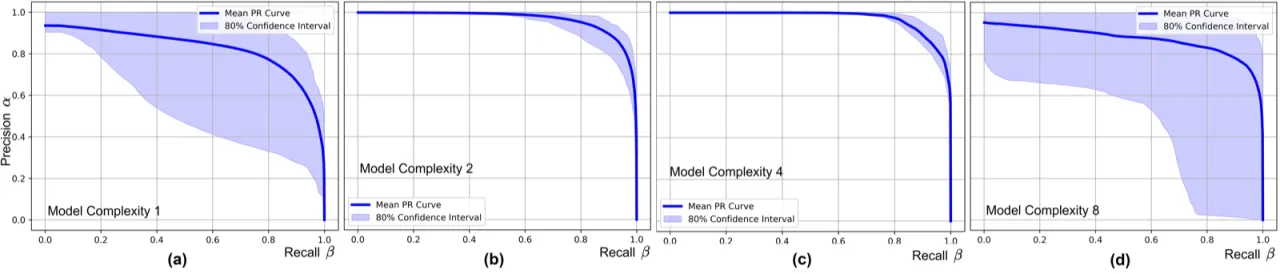
图 1:不同复杂度(C=1, 2, 4, 8 个残差块)的 DDPM 模型在截断高斯环形分布上训练所得到的集成 Precision-Recall 曲线。
阴影区域为 10th–90th 百分位区间,代表模型近似不确定性(model-induced uncertainty)。
C=2 与 C=4 的置信区间最窄,显示最低的模型不确定性。Figure 1: Ensemble Precision-Recall curves obtained by training DDPM models of varying complexity (C=1, 2, 4, 8 residual blocks) on a truncated Gaussian ring distribution. The shaded region is the 10th–90th percentile interval, representing model-induced uncertainty. C=2 and C=4 yield the narrowest confidence intervals, indicating the lowest model uncertainty.
M=30每组独立训练的模型数量Independently trained models per group
20k合成训练样本数Synthetic training samples
44.2%C=4 显著优于 C=2 的 PR 曲线占比Share of the PR curve where C=4 significantly outperforms C=2
02方法(Method)Method
本文并非提出一个完整算法,而是建立形式化框架并推荐集成 Precision-Recall 曲线作为量化工具:
对同一训练集用不同随机初始化独立训练 M 个模型,为每个模型绘制 PR 曲线,
然后在统一的 recall 网格上插值并统计百分位区间,以直观展示评估置信度。Rather than proposing a complete algorithm, this paper establishes a formal framework and recommends ensemble Precision-Recall curves as the quantification tool: train M models independently on the same training set with different random initializations, draw a PR curve for each model, then interpolate on a common recall grid and compute percentile intervals so as to display evaluation confidence directly.
作者将模型诱导不确定性(model-induced uncertainty)定义为不同初始化下分布度量指标的方差:The authors define model-induced uncertainty as the variance of the distributional metric across different initializations:
进一步,总评估不确定性(total evaluation uncertainty)同时纳入模型初始化的随机性与有限采样引入的噪声,
是生成模型可靠性评估的完整度量目标。Going further, total evaluation uncertainty additionally accounts for both the randomness of model initialization and the noise introduced by finite sampling, and constitutes the complete measurement target for assessing the reliability of generative models.
具体做法:训练 M 个独立的生成模型 → 生成各自的 PR 曲线 → 在公共 recall 网格上插值 →
计算每个 recall 点的 10th–90th 百分位置信带。
采用百分位区间而非标准差区间,是为了更好地处理小 ensemble 下的偏斜分布与离群值问题。Concretely: train M independent generative models → produce their respective PR curves → interpolate on a common recall grid → compute the 10th–90th percentile confidence band at each recall point. Percentile intervals are used instead of standard-deviation intervals in order to cope better with skewed distributions and outliers under small ensembles.
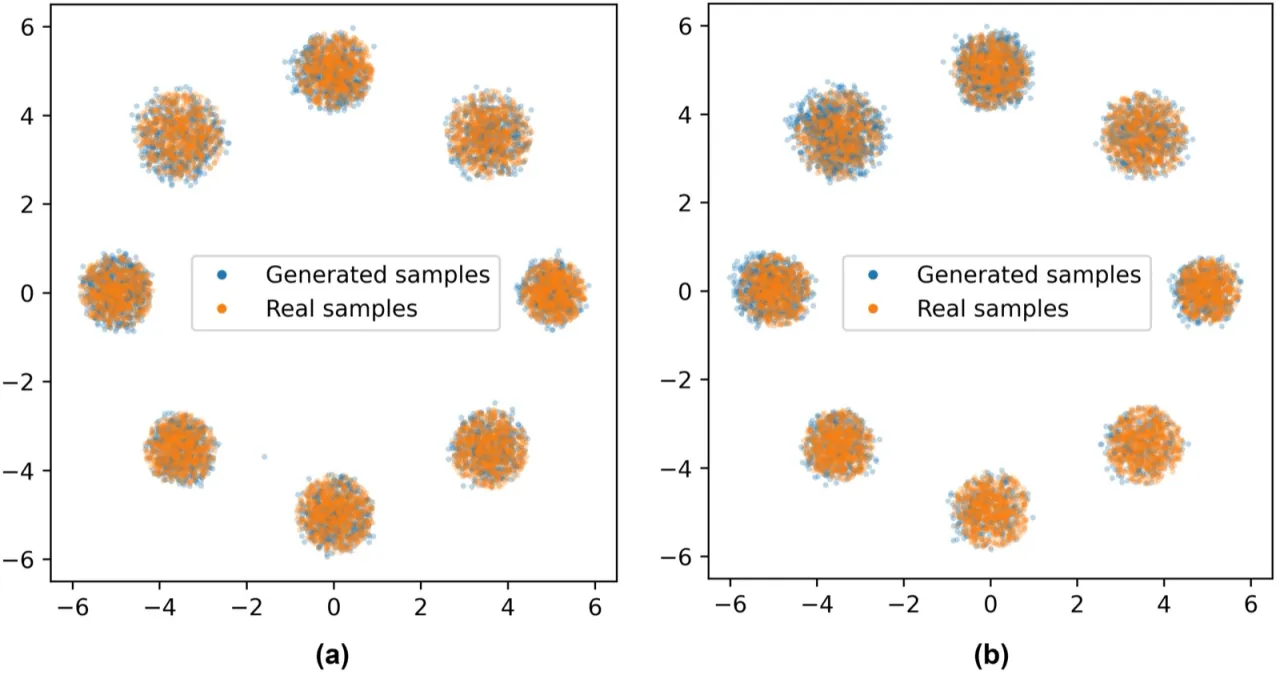
图 2:截断高斯环形分布的真实样本(左)与 C=4 的 DDPM 生成样本(右)。
两者在视觉上高度相似,但仅靠目测无法量化学习差异;PR 曲线集成正是用于精确化这种差距。Figure 2: Real samples from the truncated Gaussian ring distribution (left) versus DDPM samples generated with C=4 (right). The two are visually highly similar, yet visual inspection alone cannot quantify the learning gap; the PR curve ensemble is precisely what makes this gap measurable.
统计假设检验Statistical Hypothesis Testing
在模型比较场景下,作者引入配对 t 检验(paired t-test),
对两组 M 个模型的 PR 曲线在每个 recall 值处进行统计比较,
以检验两种配置是否存在显著性差异,为工程决策提供统计依据。In the model-comparison setting, the authors introduce the paired t-test, statistically comparing the PR curves of two groups of M models at every recall value, so as to test whether the two configurations differ significantly and to provide a statistical basis for engineering decisions.
03实验(Experiments)Experiments
实验在合成截断高斯环形分布(20,000 个样本)上训练 DDPM,
通过控制残差块数量 C ∈ {1, 2, 4, 8} 模拟欠拟合至过拟合的连续谱,
并通过改变数据集大小(5,000 / 20,000)验证数据量对评估不确定性的影响。The experiments train a DDPM on a synthetic truncated Gaussian ring distribution (20,000 samples), controlling the number of residual blocks C ∈ {1, 2, 4, 8} to simulate a continuum from underfitting to overfitting, and varying the dataset size (5,000 / 20,000) to verify the effect of data volume on evaluation uncertainty.
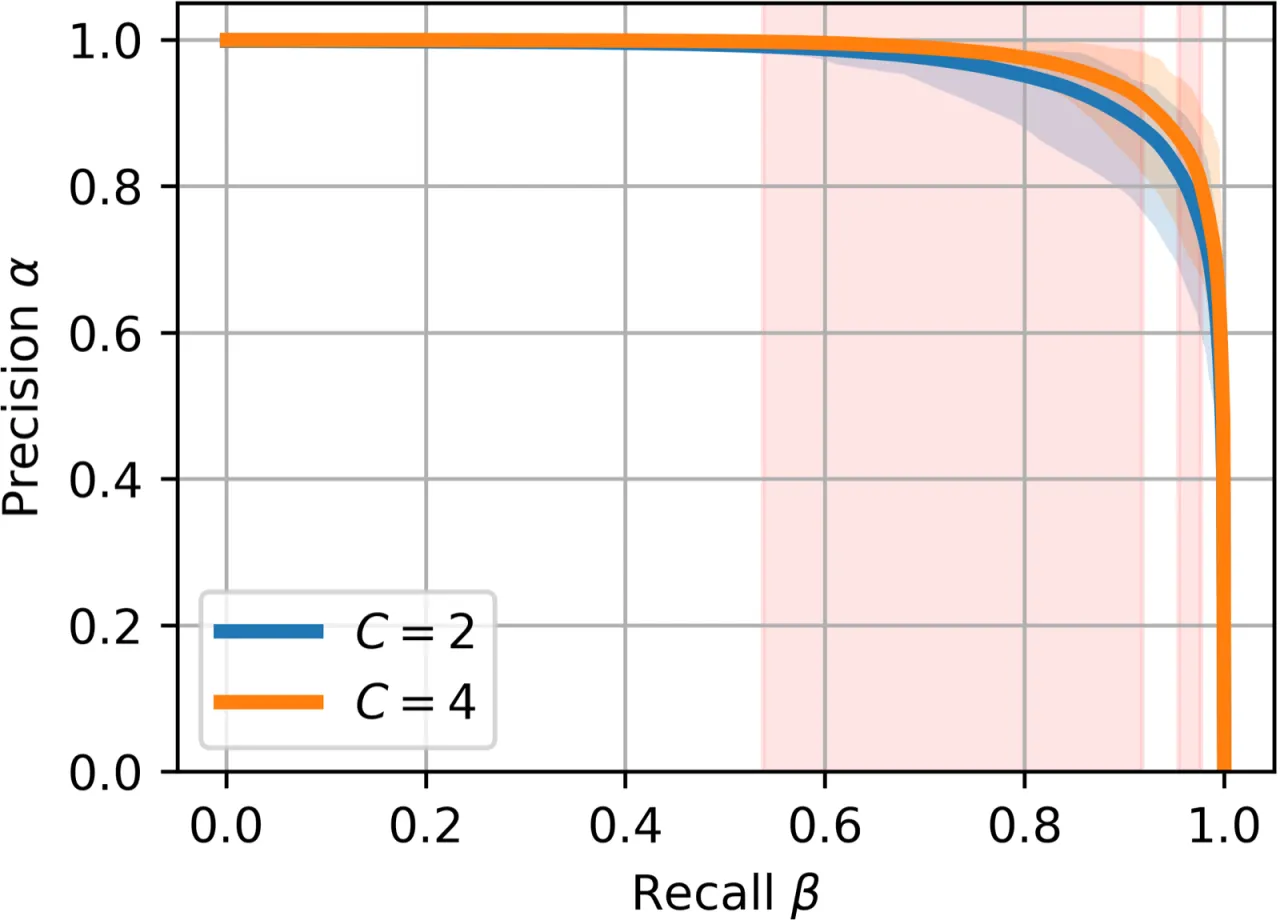
图 3:C=2 与 C=4 模型的集成 PR 曲线对比,以及配对 t 检验的显著性区域。
绿色高亮区域表示 C=4 在 0.05 显著性水平下显著优于 C=2 的 recall 区间(占曲线长度 44.2%)。Figure 3: Comparison of the ensemble PR curves of the C=2 and C=4 models, together with the significance regions from the paired t-test. The green highlighted region marks the recall interval in which C=4 significantly outperforms C=2 at the 0.05 significance level (44.2% of the curve length).
模型复杂度分析Model Complexity Analysis
模型配置Configuration
置信区间宽度Confidence interval width
结论Conclusion
C=1(单残差块)C=1 (single residual block)
最宽Widest
欠拟合,高 model uncertaintyUnderfitting, high model uncertainty
C=2
最窄之一Among the narrowest
最优复杂度候选Optimal complexity candidate
C=4
最窄之一Among the narrowest
最优复杂度候选,统计上优于 C=2Optimal complexity candidate, statistically better than C=2
C=8
较宽Wider
过拟合迹象,不确定性上升Signs of overfitting, uncertainty rises
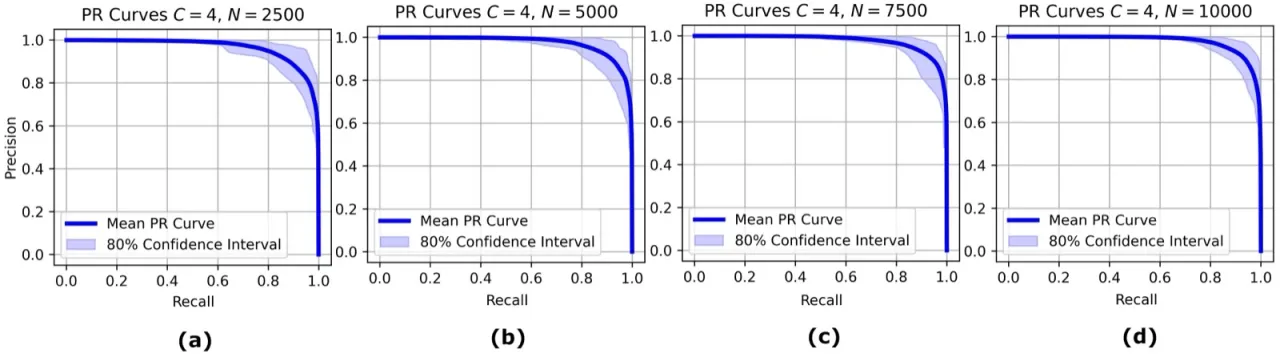
图 4:训练集大小从 20,000 缩减至 5,000 时的集成 PR 曲线变化。
小数据集导致更宽的置信区间(更高的 epistemic uncertainty),
且 "smaller datasets also led to worse performance metrics, as the area under the PR curves decreases consistently"。Figure 4: Change in the ensemble PR curves when the training set is reduced from 20,000 to 5,000 samples. Smaller datasets lead to wider confidence intervals (higher epistemic uncertainty), and "smaller datasets also led to worse performance metrics, as the area under the PR curves decreases consistently".
关键结论Key Findings
C=2 与 C=4 均产生最窄置信区间,代表最低模型近似不确定性;C=1 欠拟合、C=8 过拟合均导致不确定性上升。Both C=2 and C=4 produce the narrowest confidence intervals, representing the lowest model approximation uncertainty; C=1 underfits and C=8 overfits, and both raise uncertainty.
配对 t 检验显示:在显著性水平 0.05 下,C=4 在 44.2% 的 PR 曲线区间上显著优于 C=2。The paired t-test shows that at the 0.05 significance level, C=4 significantly outperforms C=2 over 44.2% of the PR curve range.
数据集越小,PR 曲线置信区间越宽,AUC 越低,验证了数据量对 epistemic uncertainty 的直接影响。The smaller the dataset, the wider the PR curve confidence intervals and the lower the AUC, confirming the direct effect of data volume on epistemic uncertainty.
04局限性(Limitations)Limitations
Note:Note:以下局限性均为论文作者在 Discussion 部分明确指出的。All limitations below are ones the authors explicitly point out in the Discussion section.
生成集成 PR 曲线需要训练 M 个独立模型,对于复杂生成任务而言"computationally prohibitive"。
尽管作者认为在可靠性关键应用中此开销是合理的,但大规模实际部署仍面临挑战。Producing ensemble PR curves requires training M independent models, which for complex generative tasks is "computationally prohibitive". Although the authors consider this cost justified in reliability-critical applications, large-scale practical deployment remains challenging.
特征空间依赖性(Feature Space Dependency)Feature Space Dependency
方法依赖基于 kNN 的估计器在某特征空间中计算距离。
论文指出 "the diagnostic depends on the feature space used to compute distances for the kNN-based estimator",
在高维数据(如图像)中需要预训练特征提取器,选择不同特征空间会影响结论。The method relies on a kNN-based estimator that computes distances within some feature space. The paper notes that "the diagnostic depends on the feature space used to compute distances for the kNN-based estimator"; for high-dimensional data such as images a pretrained feature extractor is required, and choosing a different feature space affects the conclusions.
百分位带可视化虽然实用,但缺乏形式化保证。
配对 t 检验假设成对差值近似正态,且在不同 recall 值上的多重检验需要校正或采用非参数置换检验替代。
M=30 的 ensemble 大小对假设检验是标准选择,但"bootstrap or permutation methods are safer for small ensemble sizes"。Percentile-band visualization is practical but lacks formal guarantees. The paired t-test assumes that the paired differences are approximately normal, and the multiple testing across different recall values requires correction or replacement by a non-parametric permutation test. An ensemble size of M=30 is a standard choice for hypothesis testing, but "bootstrap or permutation methods are safer for small ensemble sizes".
扩展性存疑(Scalability to Complex Domains)Questionable Scalability to Complex Domains
本文实验仅限于简单合成分布(二维高斯环)。
作者承认将方法迁移到高维图像数据,以及 GAN、VAE、Flow-based 等不同模型族时,
"the nature and magnitude of evaluation uncertainty might differ significantly",尚待验证。The experiments in this paper are confined to a simple synthetic distribution (a 2D Gaussian ring). The authors concede that when the method is carried over to high-dimensional image data and to different model families such as GAN, VAE and Flow-based models, "the nature and magnitude of evaluation uncertainty might differ significantly", which remains to be verified.